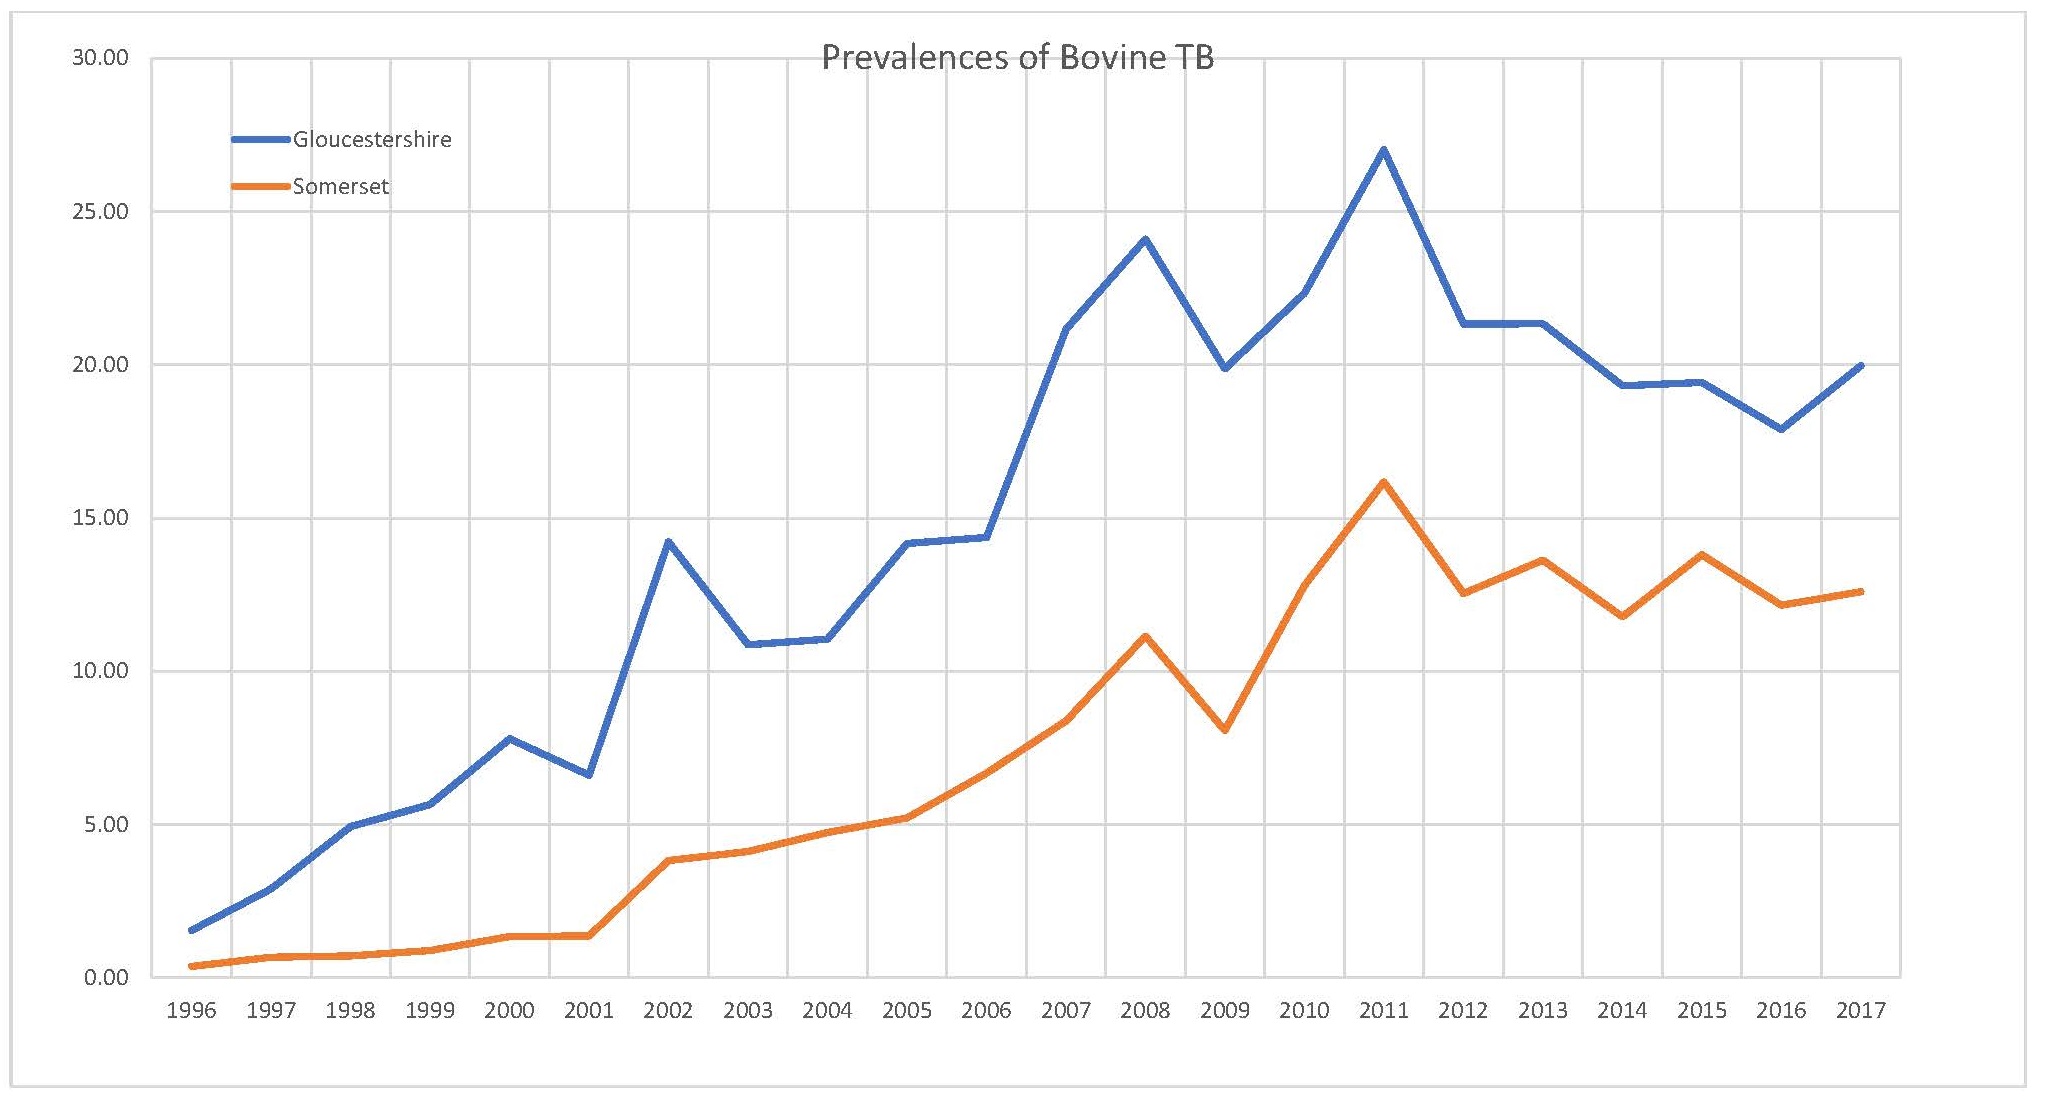
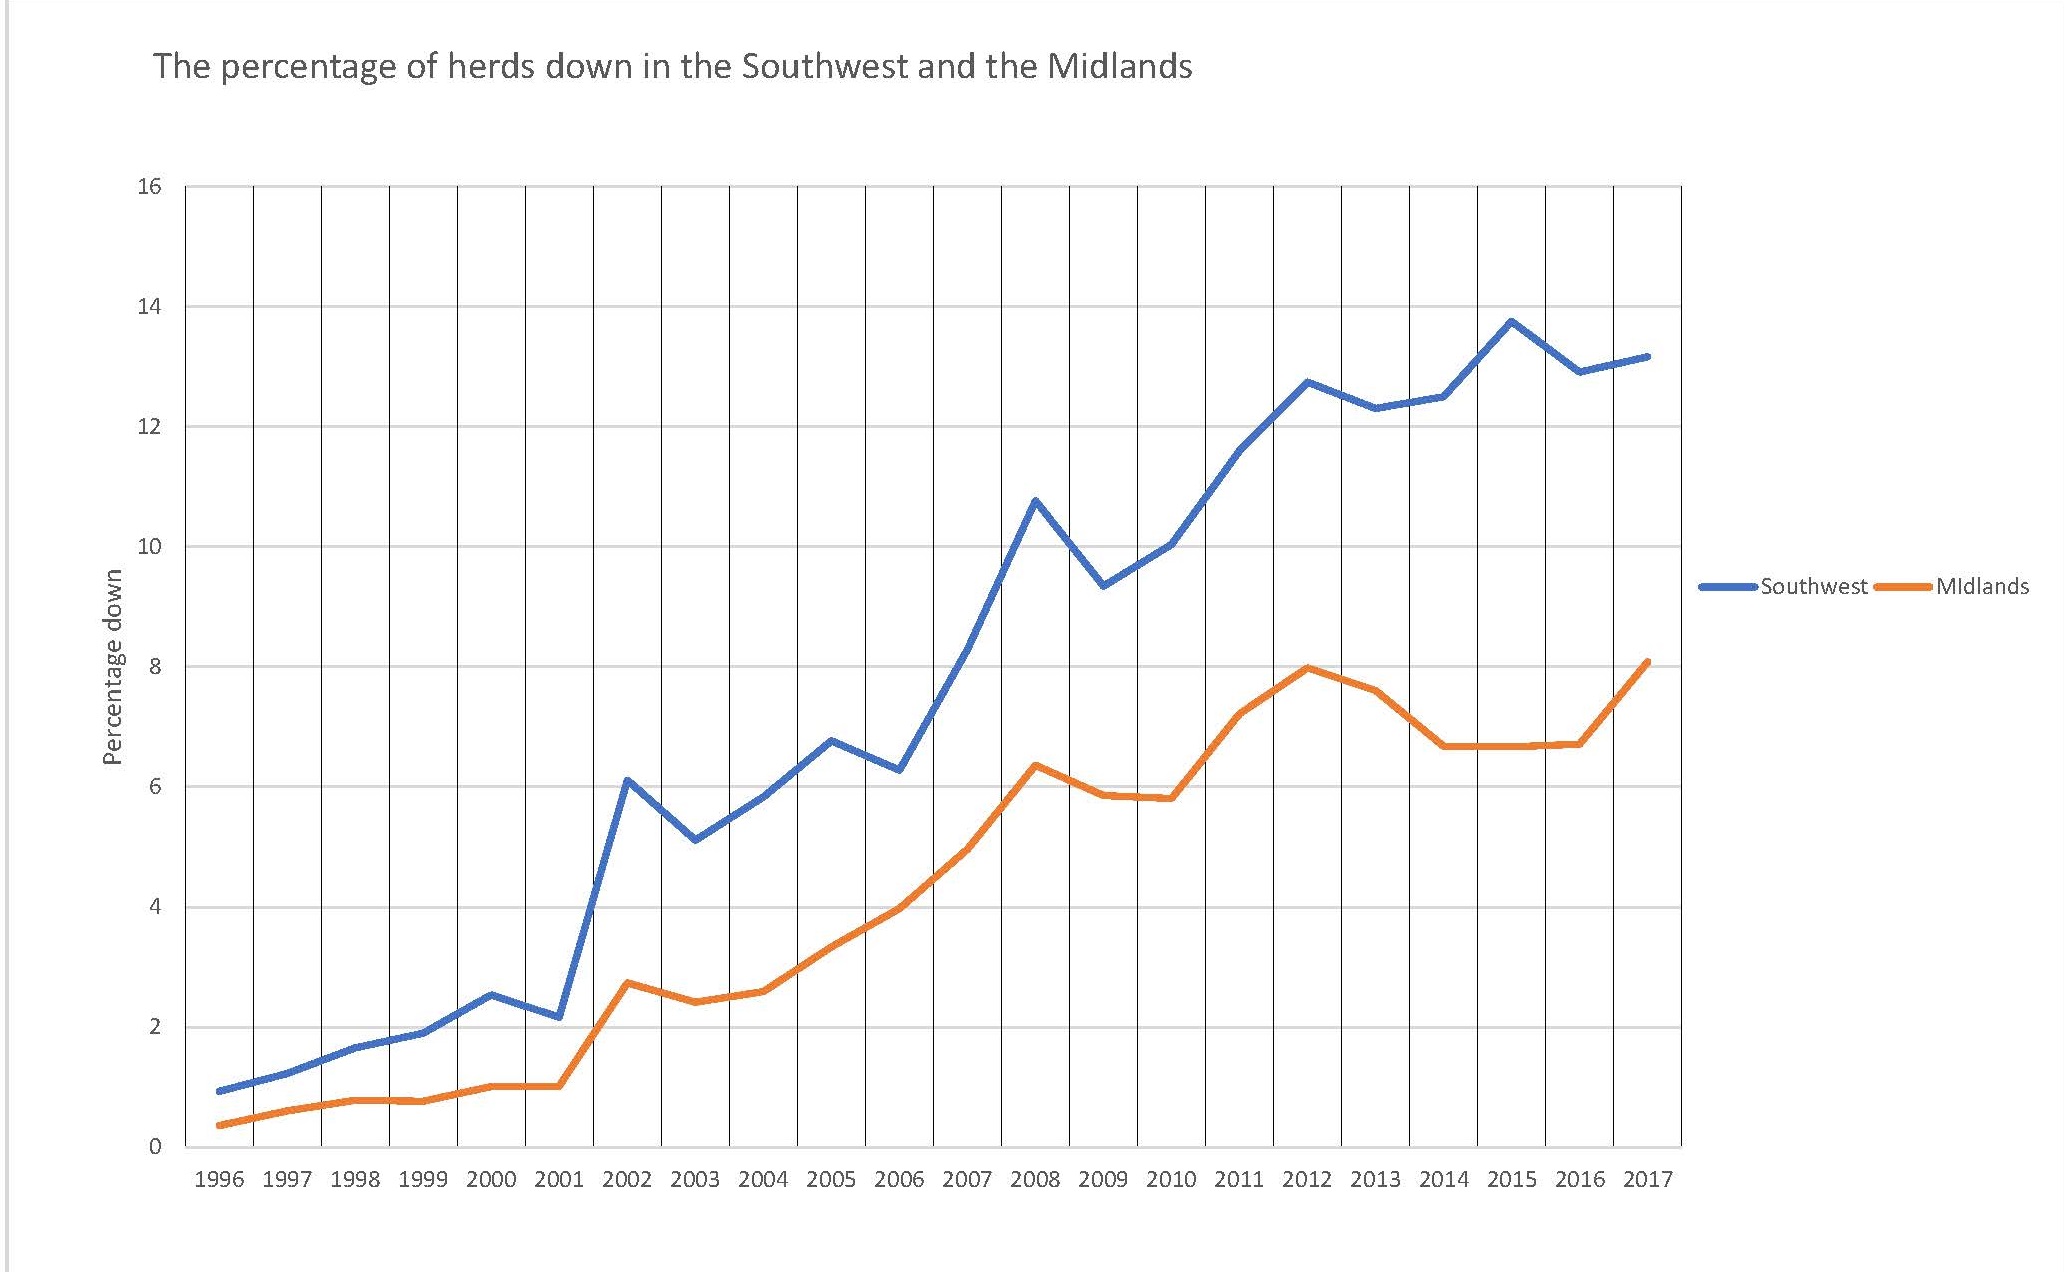
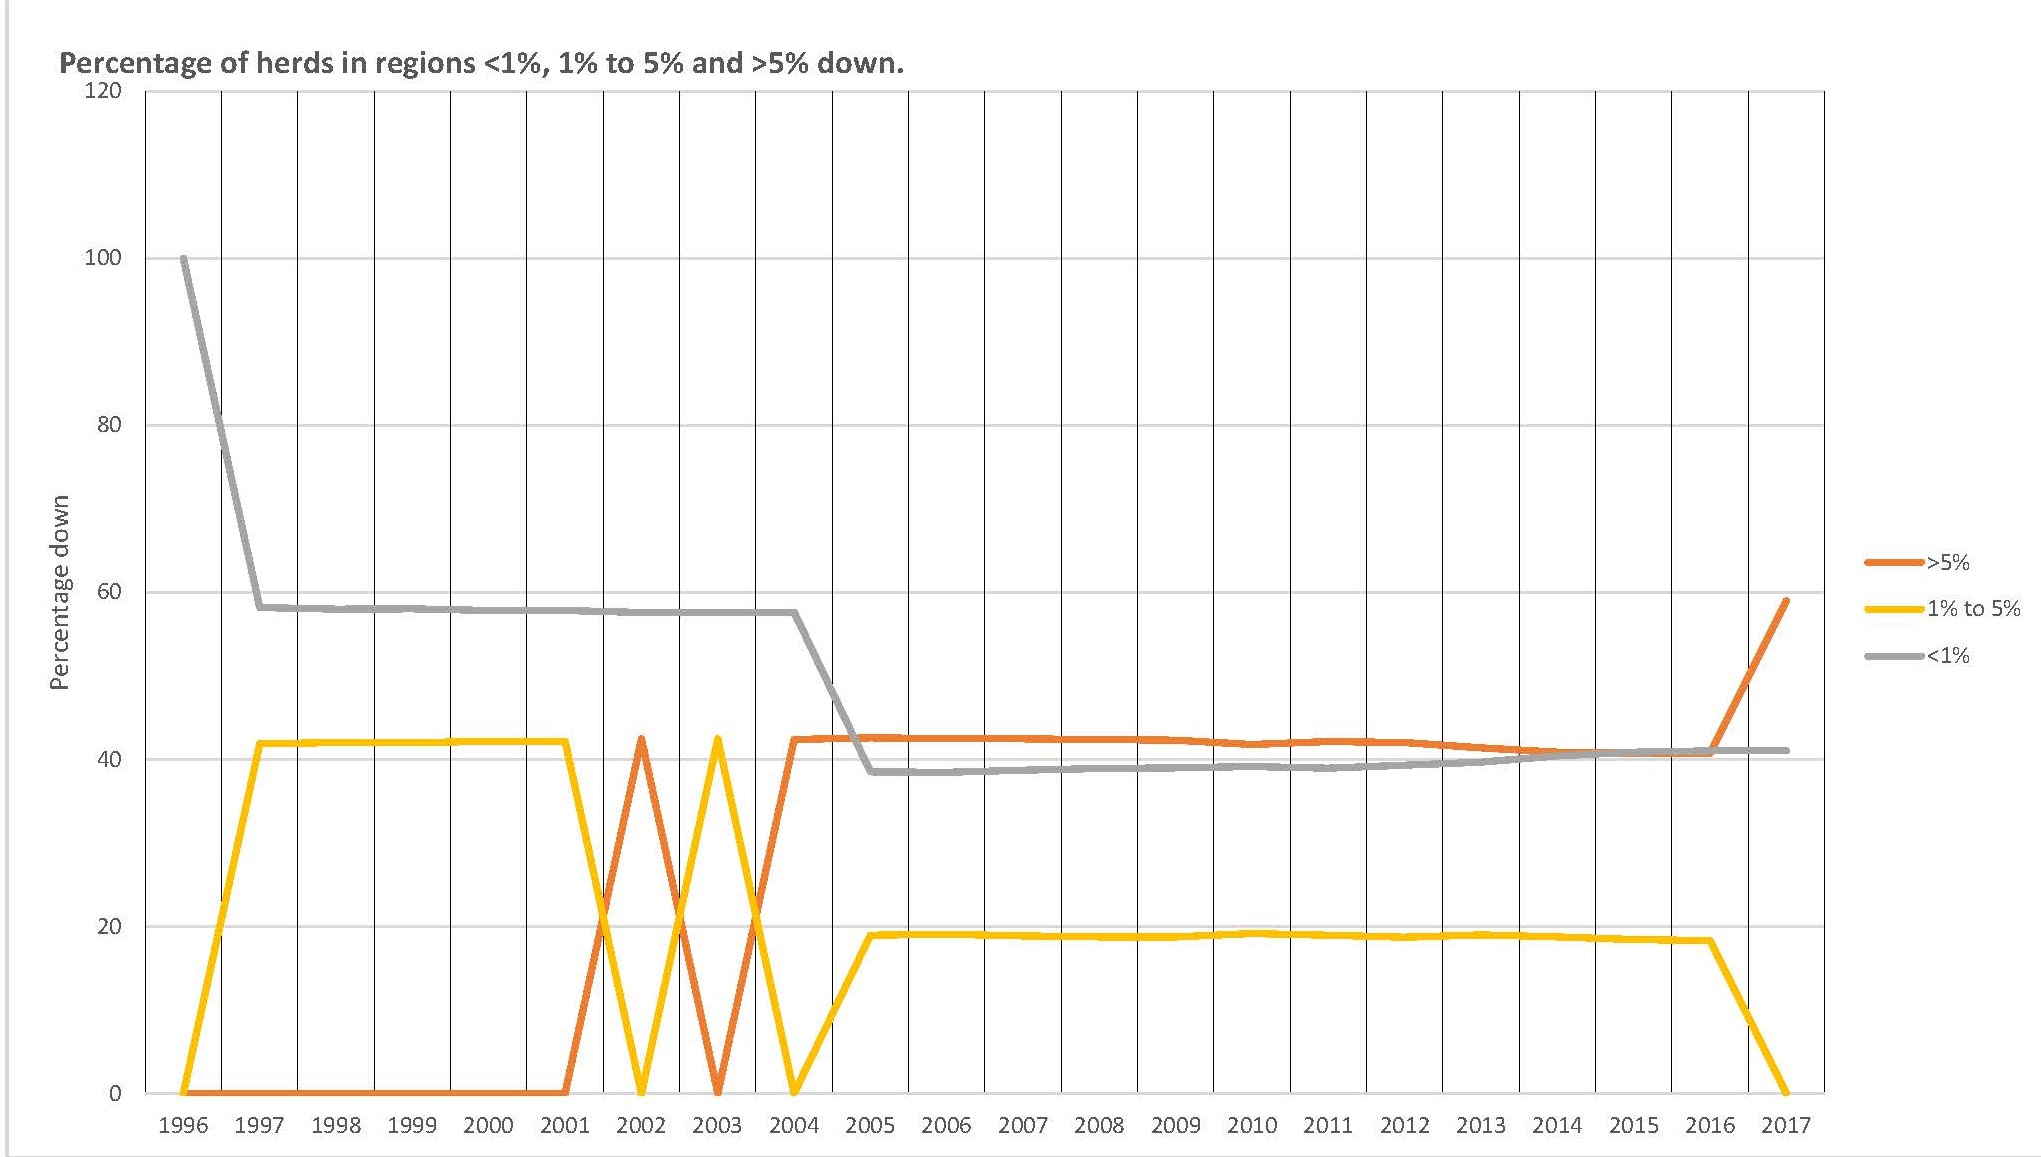
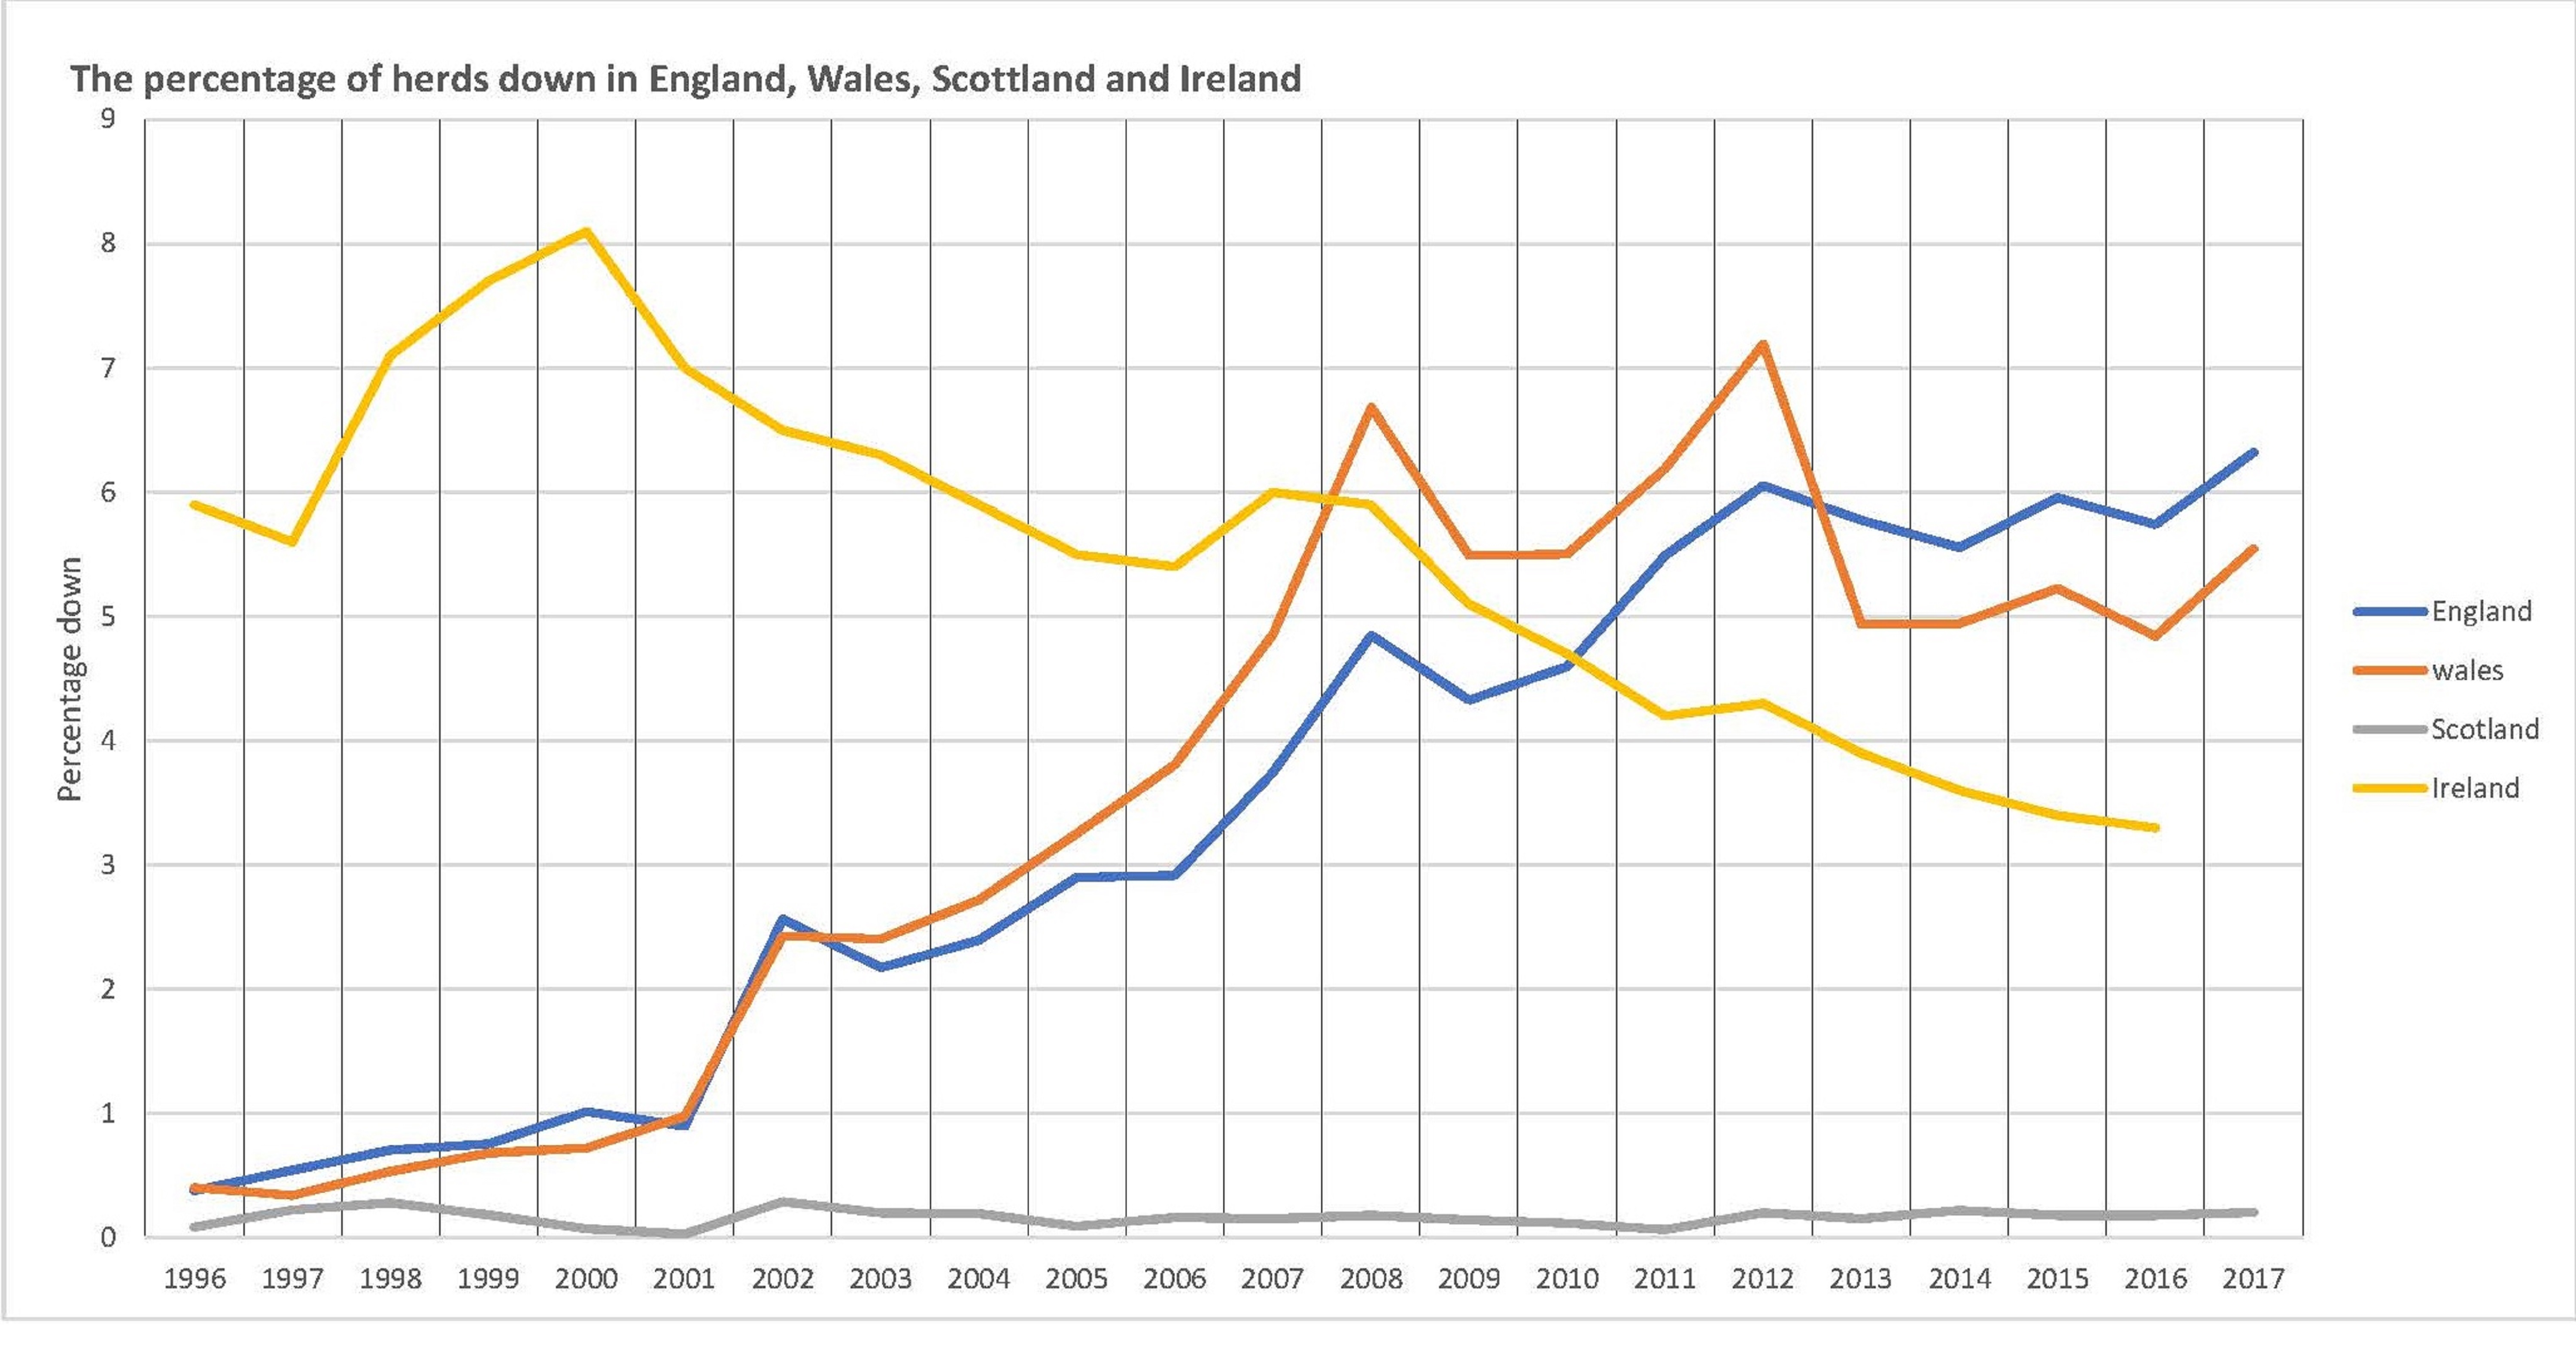
The goverment of the Uk did release the last quartal figures about the situation of bovine TB obtained from APHA.
https://www.gov.uk/government/statistical-data-sets/tuberculosis-tb-in-cattle-in-great-britain

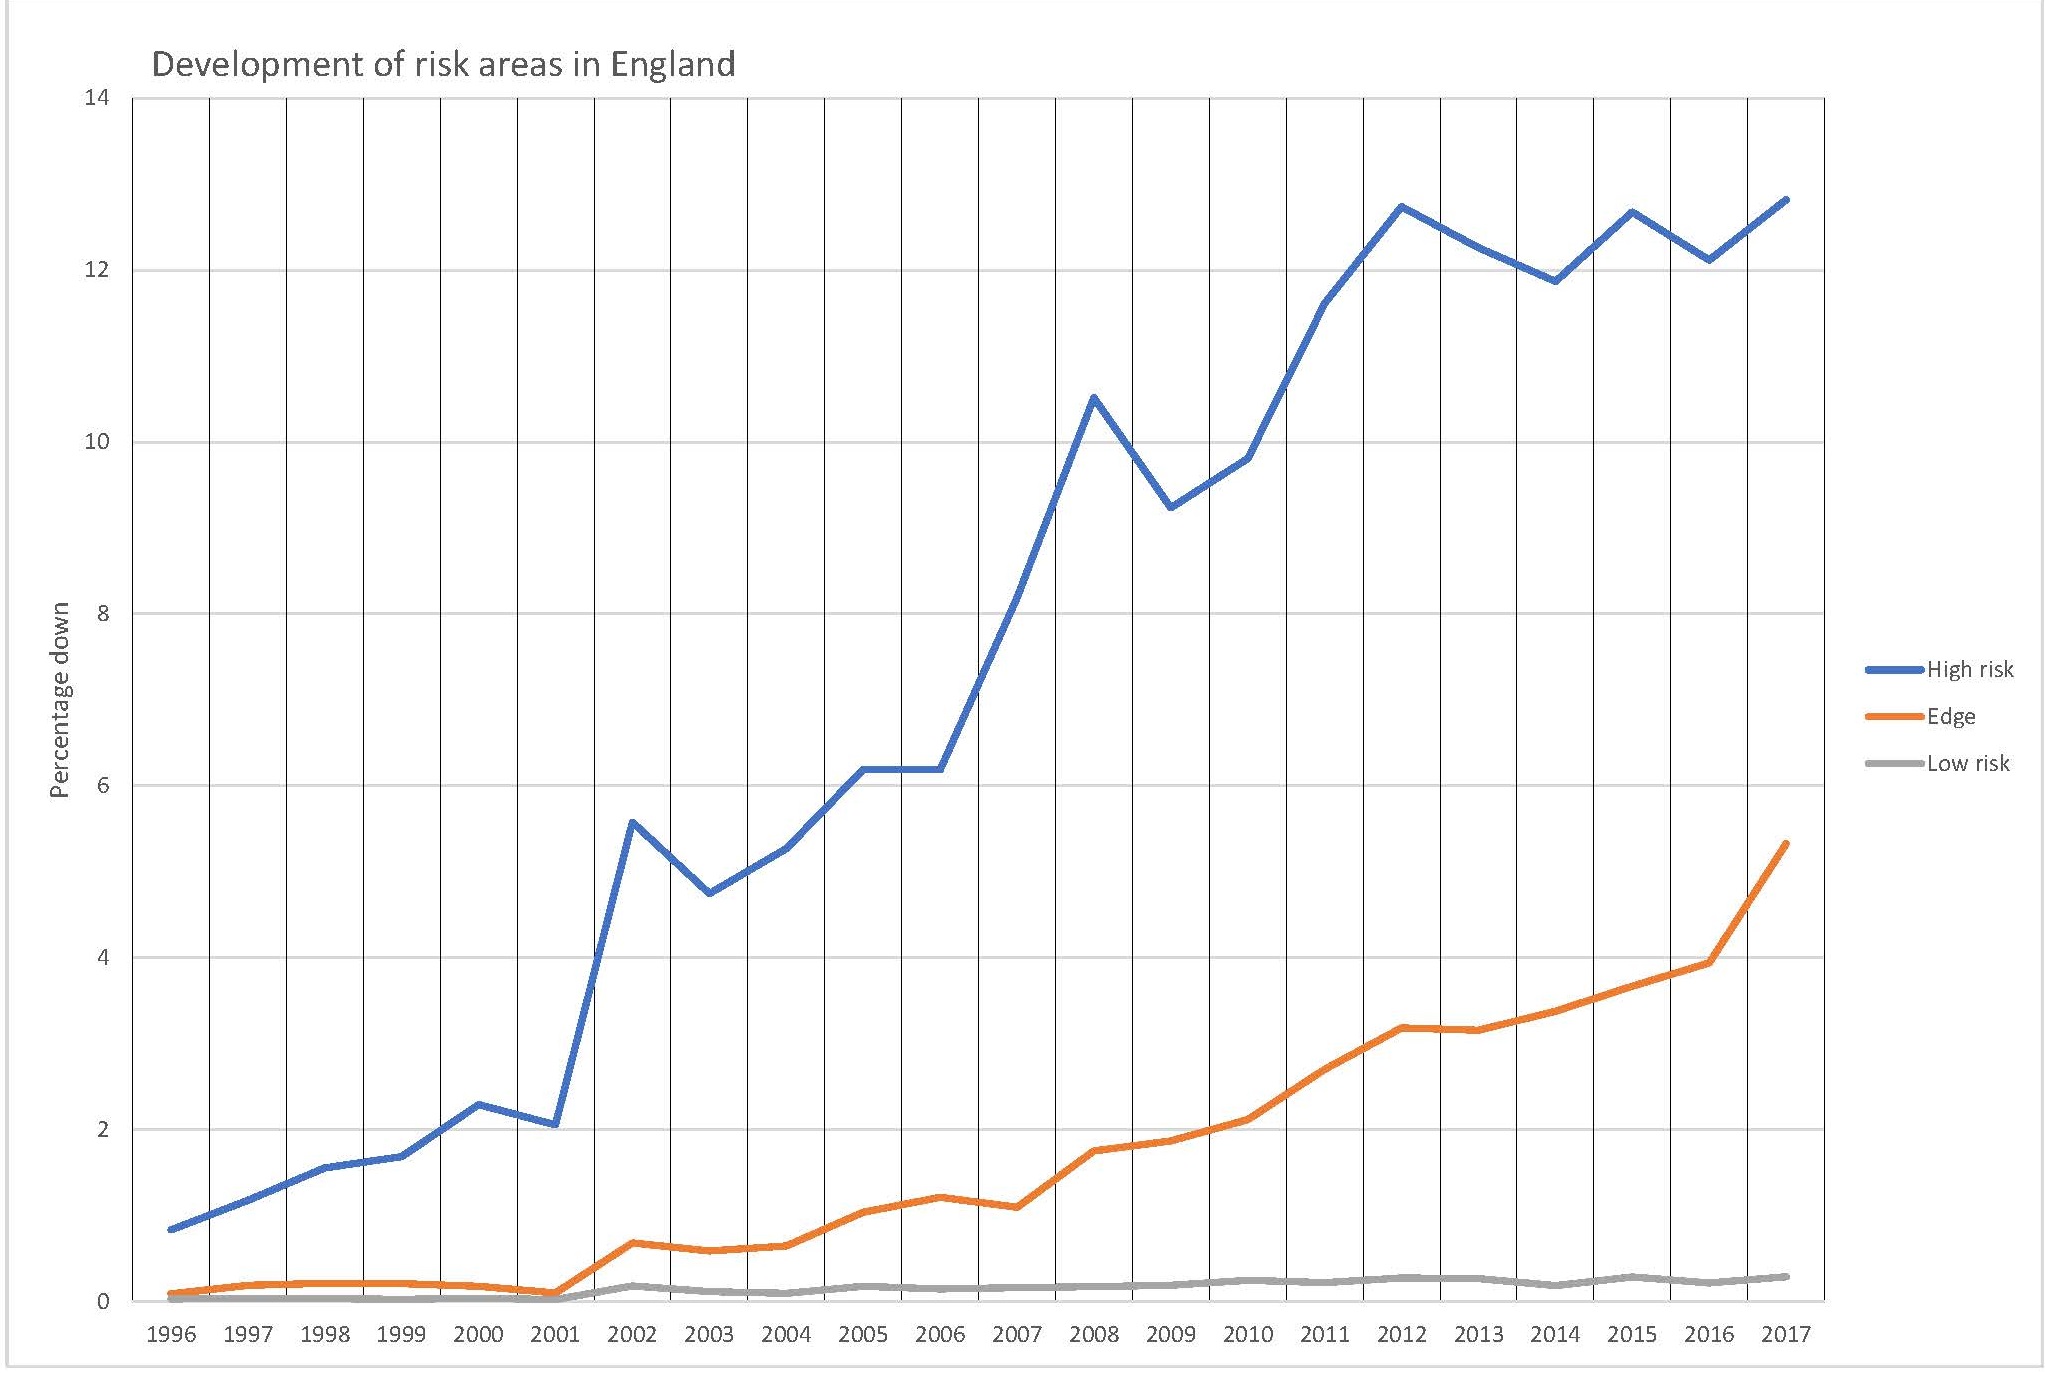
The figures show that in high risk areas the top is obviously reached. Since 2012 it is moving between 10% and 12% prevalence. In the edge areas however it seems that bovine tb is spreading unrestrained. We are now at about 5% prevalence. This means that edge areas will sooner or later become high risk areas and the amount of regions with high herd prevalence ist growing. So far there are no signs of a sucsessful control of bovine TB.
The herd prevalence is calculated by breaking the amount of herds under restriction through the amount of all herds registered on SAM. To get a percentage figure you have to multiply with hundred.
You can find the the concerning dataset here: https://assets.publishing.service.gov.uk/government/uploads/system/uploads/attachment_data/file/763660/bovinetb-gb-countries-12dec18.ods
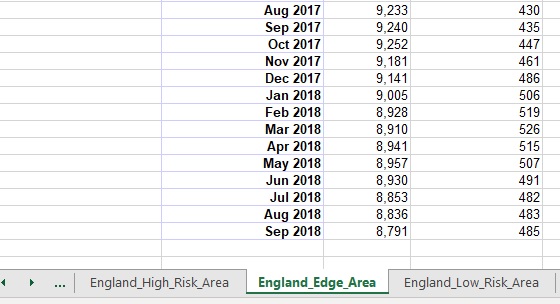
Select the Edge Area Sheet in the file and go to the columns:
“Number of cattle herds registered on Sam” and
“Herds not officially TB free at the end of the period due to a bovine TB incident”

Then scroll down to the rows with the monthly figures:
The Excel file the graph above is created with:
http://wf2g2bm3y.homepage.t-online.de/0012/wp-content/uploads/2018/12/st1.xlsx
